Data Visualization
Challenge
Product webpages and print sales materials tell a story. When information is quickly understood there is more time to focus on the selling process. This concept influences many of the financial sales and marketing resources. It's a full-brain sport to analyze the data and present a graphic representation.
Solution
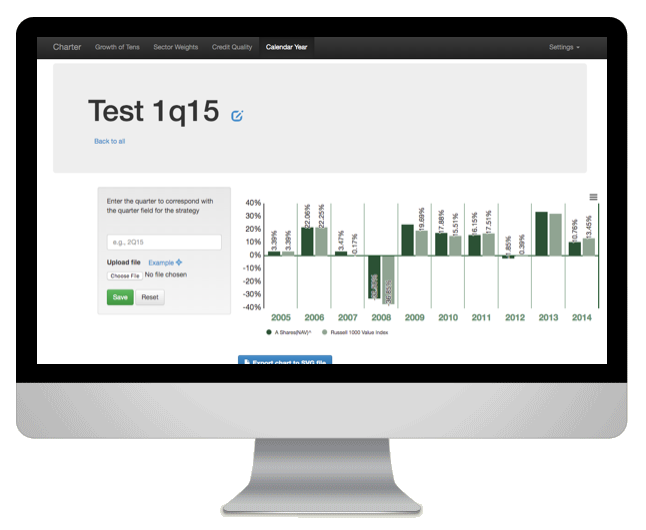
This specific charting tool was an important step in fully automating quarterly financial reports. The web-based tool replaced a more manual resource and maintained the styles from one quarter to another. This allowed for a more programmatic approach to developing the sales resources.
Results
This proof of concept was used to expand the client deliverables threefold while reducing the amount of time to create the files. Without the programmatic support, the semi-automated print work would have risked taking too long. Maintaining the quality presentation of information was a requirement, and the end results are impossible to distinguish the programatically generated designs from the handcrafted designs.